gnuplot
手軽に使えるプロッターであるgnuplotのテスト。
gnuplot> set grid
gnuplot> plot [x=0:15] sin(x)*cos(x)/x
gnuplot> set terminal postscript eps
gnuplot> set output "ex2d.eps"
gnuplot> replot
gnuplot> set hidden3d
gnuplot> set sample 30
gnuplot> set isosamples 30
gnuplot> set contour base
gnuplot> splot [x=-15:15] [y=-15:15] sin(x)/x*sin(y)
gnuplot> set terminal postscript eps
gnuplot> set output "ex3d.eps"
gnuplot> replot
gnuplot> plot "test.prn","fitting.dat"
gnuplot> set terminal postscript
gnuplot> set output "gnuplot-fitting.ps"
gnuplot> replot
[perl] 最小二乗法(LSM)
パッケージを使わずに、perlで最小二乗法(LSM)してみる。この程度の最小自乗法は簡単。

最後に、下のように行列計算を行って結果を出力するんだな。
[∑y_n*x_n]=[∑x_n*x_n ∑x_n][a]
[∑y_n    ] [∑x_n     ∑1  ][b]
C:\WINDOWS\デスクトップ>perl -alne "$d=$F[2]*$F[4]-$F[0]**2;@a=(($F[4]*$F[3]-$F[0]*$F[1])/$d,($F[2]*$F[1]-$F[0]*$F[3])/$d);END{print \"@a\";}" c.dat
1.03341121358083 1.1275431582802
C:\WINDOWS\デスクトップ>
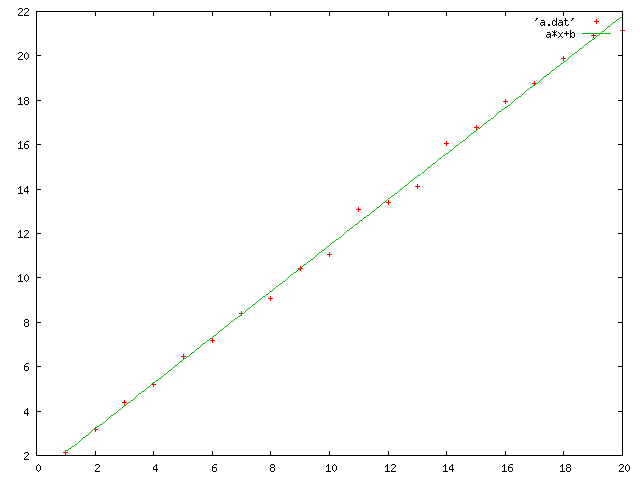
1つ目がa、2つ目がbなんだな。自信がないのでgnuplotで確かめてみるんだな。
gnuplot> fit a*x+b 'a.dat' via a,b
Final set of parameters            Asymptotic Standard Error
=======================            ==========================
a               = 1.03341          +/- 0.01167      (1.129%)
b               = 1.12754          +/- 0.1398       (12.4%)
correlation matrix of the fit parameters:
               a      b
a               1.000
b              -0.877  1.000
gnuplot> print a
1.03341121360931
gnuplot> print b
1.12754315789153
gnuplot> plot 'a.dat',a*x+b
確かに近い値となっていることがわかるんだな。完成したのでGIFで出力しておくんだな。
gnuplot> set terminal gif
Terminal type set to 'gif'
Options are 'small size 640,480 '
gnuplot> set output 'a.gif'
gnuplot> plot 'a.dat',a*x+b
gnuplot>
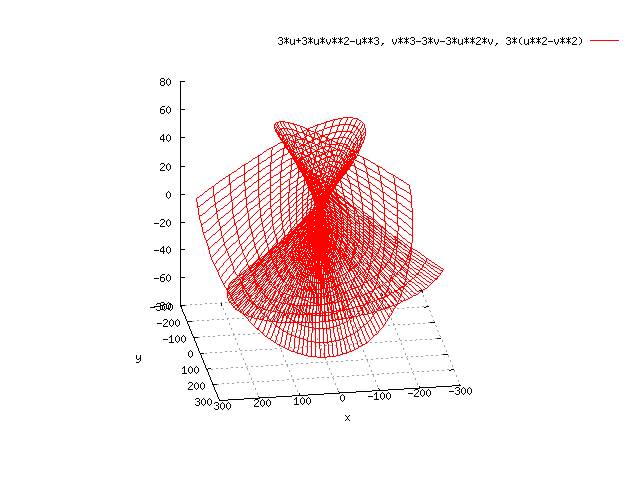
[gnuplot] enper.plt

set terminal gif
set output "enper.gif"
set parametricset size square
set gridset ticslevel 0
set xlabel "x"
set ylabel "y"
set isosample 72,36
splot 3*u+3*u*v**2-u**3,v**3-3*v-3*u**2*v,3*(u**2-v**2)
exit
[gnuplot] gnuplot4.plt

[gnuplot] gnuplot3.plt
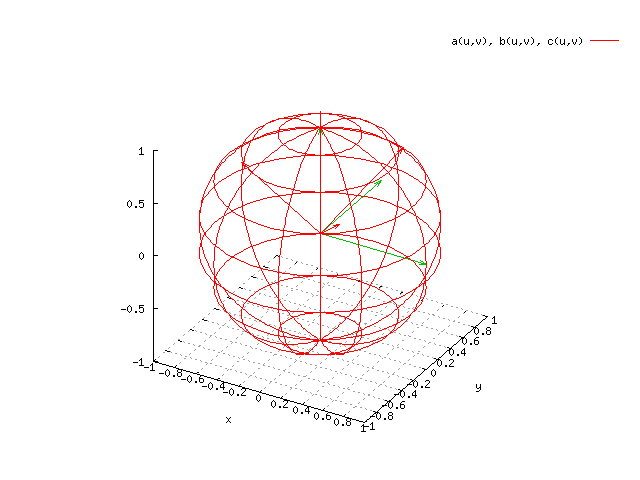
gnuplotのプロットサンプル。こんな面倒な計算も出来るということで。
[gnuplot] gnuplot2.plt
gnuplotで適当に難しいグラフを描いてみる。
[gnuplot] gnuplot1.plt
gnuplot で適当に難しいグラフを描いてみる。自分でも何を書いたか忘れちゃったよ。